Evaluations & analyses

And that’s not all: our software presents your data in a clear and concise manner, relates it to one another in terms of time and logic and offers simple and intuitive navigation options.
WiriTec makes data analysis uncomplicated and, thanks to our specially optimized measurement data server, enables real-time evaluations without delays, even with huge data sets. Experience ultimate flexibility with tools such as the time slider, which allows you to navigate seamlessly through time points and time periods – for absolute (a specific date or time period) and relative (the last 3 days, the last month, etc.) time periods. Easily customize reports, from fiscal years to specific times of day, and refine views with drag and drop.
Fast, customizable, precise – that’s data analysis with WiriTec.
Live Charts
The integrated chart component enables a wide range of graphical analyses directly from the database for maximum flexibility.
Once configured, charts can be saved and updated with current data at any time.
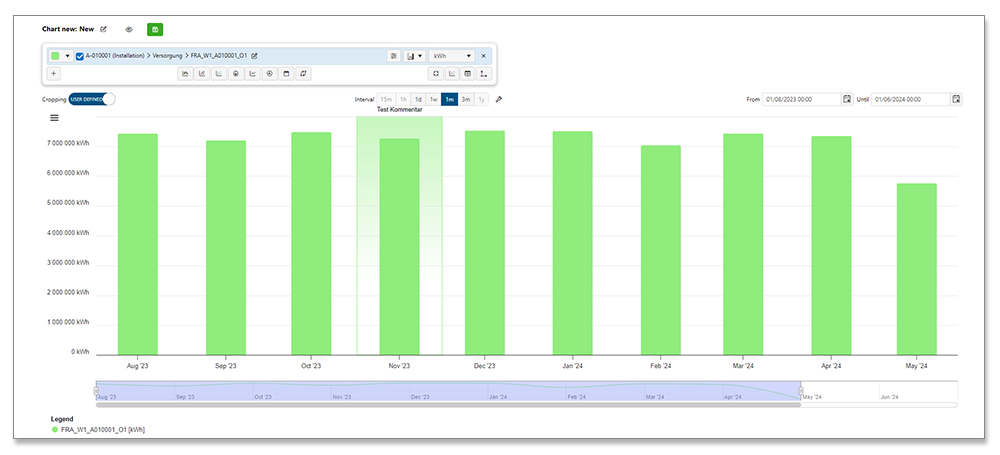
Figure: Bar chart
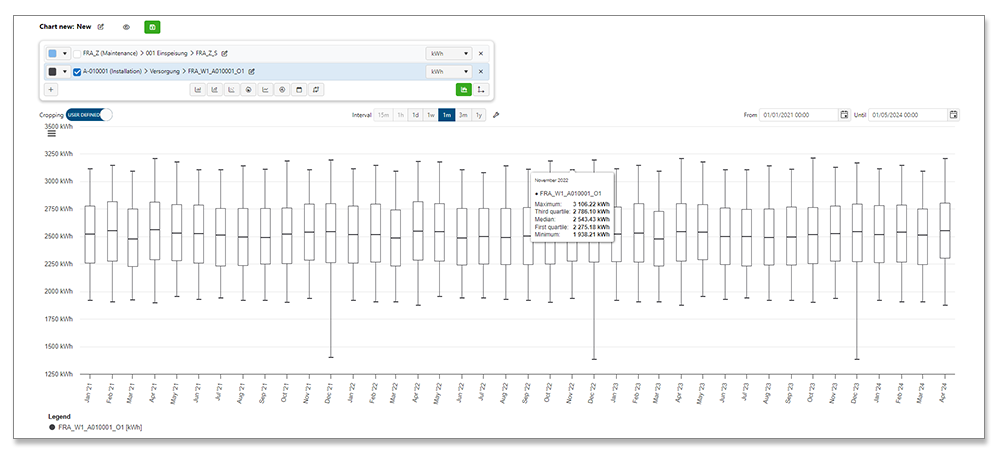
Figure: Box plot
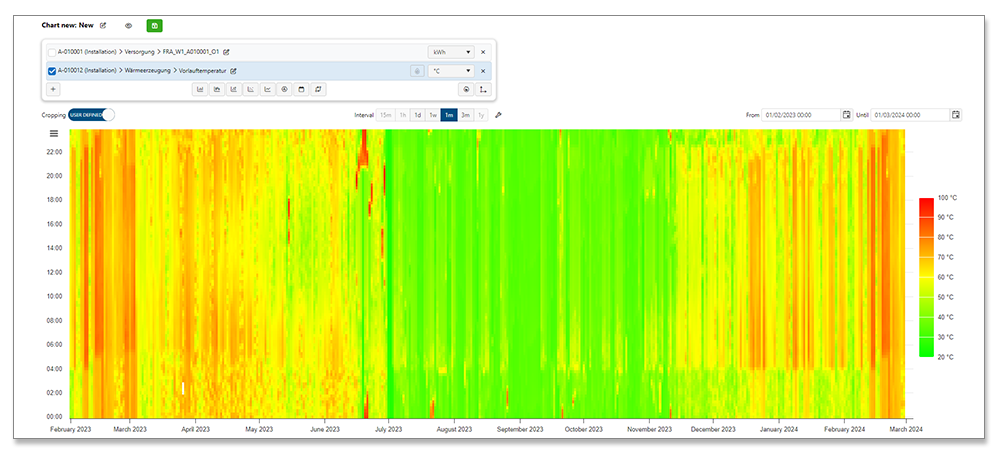
Figure: Head map
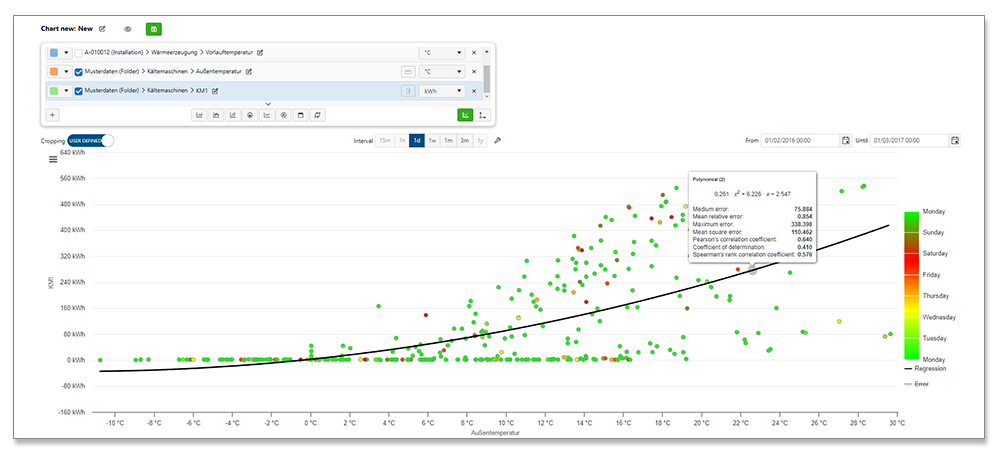
Figure: Scatter plot
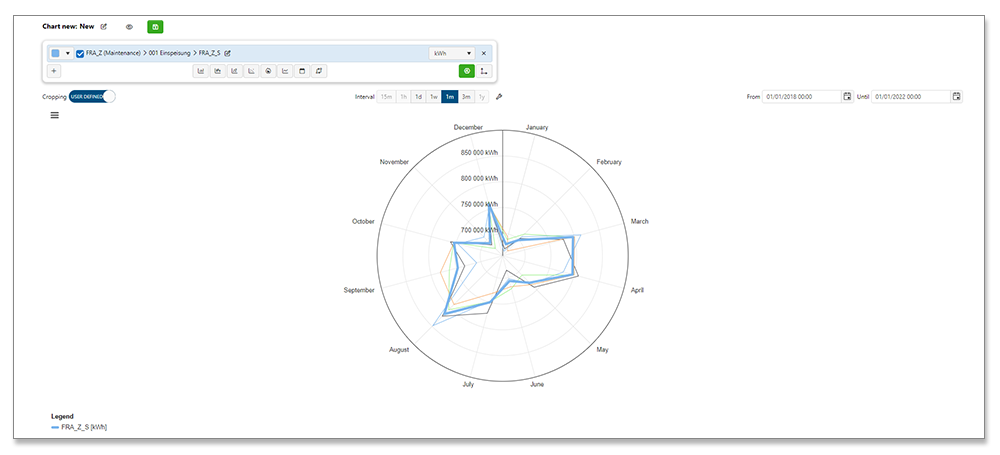
Figure: Polar chart
Dashboards & Reports
Efficient energy management requires clear visualization of diverse data and correlations.
WiriTec® C enables the creation of dashboards and cockpits to present data clearly and attractively.
WiriTec® C‘s powerful report generator also facilitates the creation of complex reports.
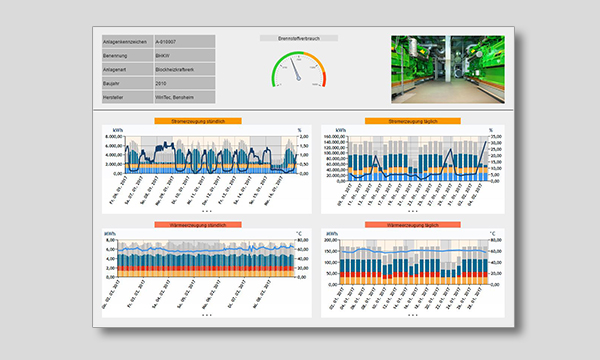
Figure: Rasterdashboards
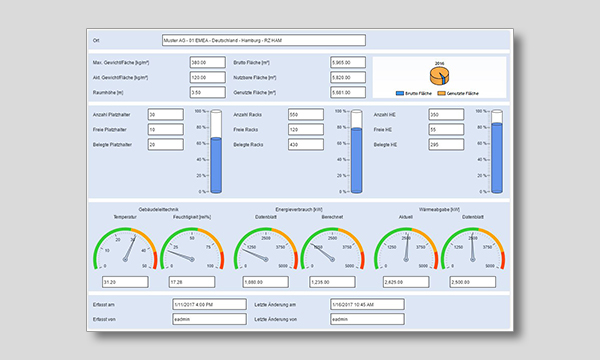
Figure: Evaluation mask
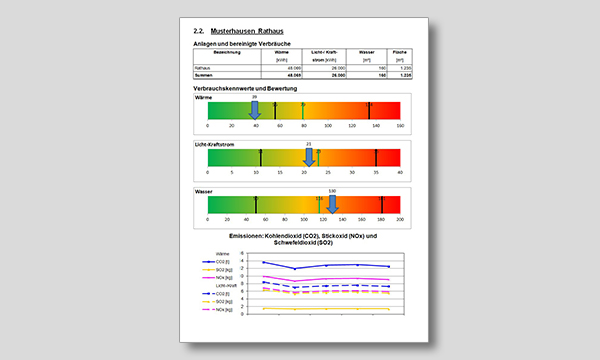
Figure: Sample reports
Data Analytics
The formula editor, a standard, powerful tool in WiriTec® C, allows for detailed analyses and the visualization of mathematical relationships in measurement data, buildings, machines and systems. Easy to use thanks to its C# basis and ready-made function blocks, the editor supports in-depth data evaluations,
from simple summations to complex calculations.
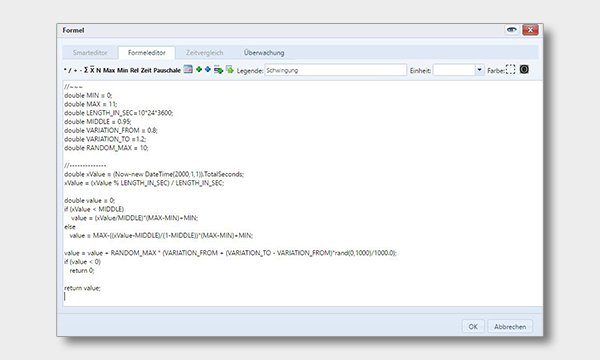
Figure: Formel editor
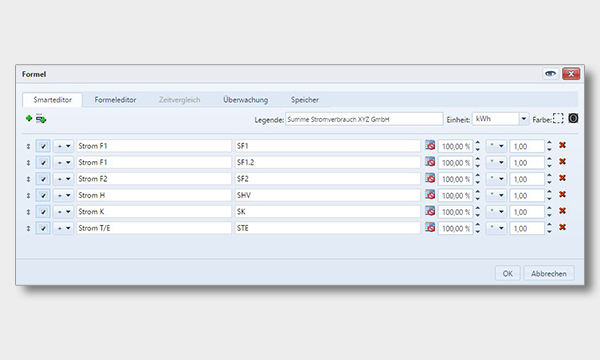
Figure: Smarteditor
Would you like to see the evaluations and analyses live?
Then book a free demo with us – we’re happy to show you examples from our software!


